

Steps to Build Your Own Automated Machine Learning App
In this article, we will create an automated machine learning web app you can actually use.


There's a good chance you have heard of the open-source AutoML tool TPOT, aka your data science assistant. In any event, exploring AutoML and the knobs of machine learning optimization can make more sense when those knobs are visible and easily adjustable. In this article, we will implement a version of the TPOT example as a Streamlit app.
If you don't know about Streamlit, this is the 30,000-foot overview:
Streamlit turns data scripts into shareable web apps in minutes. All in Python. All for free. No front‑end experience required.**
Overview
Along with getting a quick intro on implementing Streamlit projects, you will end up with a sandbox web app allowing for pipeline optimization experiments with TPOT using a pair of well-known datasets. With a few modifications, you should also be able to get the sandbox running with other datasets and expand the functionality to include more knobs as well. In a nutshell, we are creating a script to automate the optimization of preprocessing and modeling — including a limited number of preprocessing transformations as well as algorithm selection — of a classification task on the iris and digits datasets. Sure, boring datasets, but using well-known data to set the app up isn't a bad idea.
Some points of note about what this optimization process entails, beyond the above, include:
- Cross-validation for model evaluation Iterating on the modeling more than once (due to the use of genetic algorithms internally for TPOT) — likely not useful on such a small dataset, but possibly will be as we progress Comparing resulting pipelines on these multiple iterations — are they all the same? Did you know TPOT now uses PyTorch under the hood to build neural networks for prediction? That last point won't factor into what we're doing today, but keep it in mind for future adventures.
Let's look at the code needed to create this simple Streamlit app.
The Code
import streamlit as st

import timeit
import pandas as pd
import matplotlib.pyplot as plt

from tpot import TPOTClassifier
from sklearn.model_selection import StratifiedKFold
from sklearn.model_selection import train_test_split
from sklearn.datasets import load_digits, load_iris
from sklearn import metrics
from stqdm import stqdm
The final import, stqdm, is a tqdm-style progress bar written specifically to work with Streamlit.
Next, here's the data loader function:
@st.cache
def load_data(dataset, train_size, test_size, random_state):
    """Load data"""
    ds = ''
    if dataset == 'digits':
        ds = load_digits()
        df = load_digits(as_frame=True)
    if dataset == 'iris':
        ds = load_iris()
        df = load_iris(as_frame=True)
    X_train, X_test, y_train, y_test = train_test_split(ds.data, ds.target, train_size=train_size, test_size=test_size, random_state=random_state)
    return X_train, X_test, y_train, y_test, df['frame']
We use the load_iris() and load_digits() functions from Scikit-learn (with which TPOT integrates closely) to pull the respective datasets. Note that they are split into train and test sets here, and train/test features/labels are all returned separately, along with a full dataset dataframe to be used for presentation to the user, as it looks much nicer, especially when presented by Streamlit (Streamlit is able to interpret and properly display a wide range of objects using its write() method). There are other ways to accomplish this, but this was simple and not a problem for such small datasets. Note the @st.cache decorator which caches the results of the function for future runs of the app, instead of reloading the data every time.
Now we set some application wide Streamlit configurations, setup a sidebar, assign some variables, and load the data using the above function:
Set title and description
st.title("AutoML Pipeline Optimization Sandbox") st.write("Experiment with using open source automated machine learning tool TPOT for building fully-automated prediction pipelines")
Create sidebar
sidebar = st.sidebar
dataset = sidebar.selectbox('Dataset', ['iris','digits'])
train_display = sidebar.checkbox('Display training data', value=True)
search_iters = sidebar.slider('Number of search iterations', min_value=1, max_value=5)
generations = sidebar.slider('Number of generations', min_value=1, max_value=10)
population_size = sidebar.select_slider('Population size', options=[10,20,30,40,50,60,70,80,90,100])

random_state = 42
train_size = 0.75
test_size = 1.0 - train_size
checkpoint_folder = './tpot_checkpoints'
output_folder = './tpot_output'
verbosity = 0
n_jobs = -1
times = []
best_pipes = []
scores = []
Load (and display?) data
X_train, X_test, y_train, y_test, df = load_data(dataset)
if train_display:
    st.write(df)
Comparing the code above, where relevant, to either the previous article in which we implemented this as a standalone script or to the Streamlit cheat sheet, this should all, again, be quite straightforward.
Note the ease of setting up interactive user-configurable variables which are then used in our code, as well as the ease of setting up the sidebar. We are able to use the sliders, checkbox, and select box to select and display the dataset, as well as set the number of search iterations, generations, and population size for the genetic algorithms TPOT uses internally for its optimization process. It should be getting easier to see how opening this up to custom datasets can be accomplished without too much trouble.
Next, let's define the scoring method; model evaluation method; and the actual search method. After this, the optimization loop is shown, which includes the display of some iteration-specific output for the user's benefit.
Define scoring metric and model evaluation method
scoring = 'accuracy'
cv = ('stratified k-fold cross-validation',
StratifiedKFold(n_splits=10,
shuffle=True,
random_state=random_state))
Define search
tpot = TPOTClassifier(cv=cv[1],
              scoring=scoring,
                  verbosity=verbosity,
              random_state=random_state,
              n_jobs=n_jobs,
              generations=generations,
              population_size=population_size,
              periodic_checkpoint_folder=checkpoint_folder)
Pipeline optimization iterations
with st.spinner(text='Pipeline optimization in progress'):
    for i in stqdm(range(search_iters)):
        start_time = timeit.default_timer()
        tpot.fit(X_train, y_train)
        elapsed = timeit.default_timer() - start_time
        score = tpot.score(X_test, y_test)
        best_pipes.append(tpot.fitted_pipeline_)
        st.write(f'\n__Pipeline optimization iteration: {i}__\n')
        st.write(f'* Elapsed time: {elapsed} seconds')
        st.write(f'* Pipeline score on test data: {score}')
    tpot.export(f'{output_folder}/tpot_{dataset}_pipeline_{i}.py')
At this point, you should compare the the write(), spinner(), success(), and other display functionality in the Streamlit cheat sheet.
Once run, the above optimization loop will output something similar to the following:
![tpot_streamlit_2.jpg] (cdn.hashnode.com/res/hashnode/image/upload/..) Finally, we need to assess our results:
check if pipelines are the same
result = True
first_pipe = str(best_pipes[0])
for pipe in best_pipes:
if first_pipe != str(pipe):
result = False
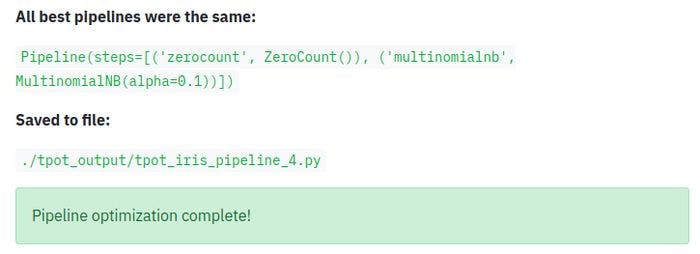
if (result):
st.write("\n__All best pipelines were the same:__\n")
st.write(best_pipes[0])
else:
st.write('\nBest pipelines:\n')
st.write(*best_pipes, sep='\n\n')
st.write('__Saved to file:__\n')
st.write(f'```{output_folder}/tpot_{dataset}_pipeline_{i}.py```')
st.success("Pipeline optimization complete!")
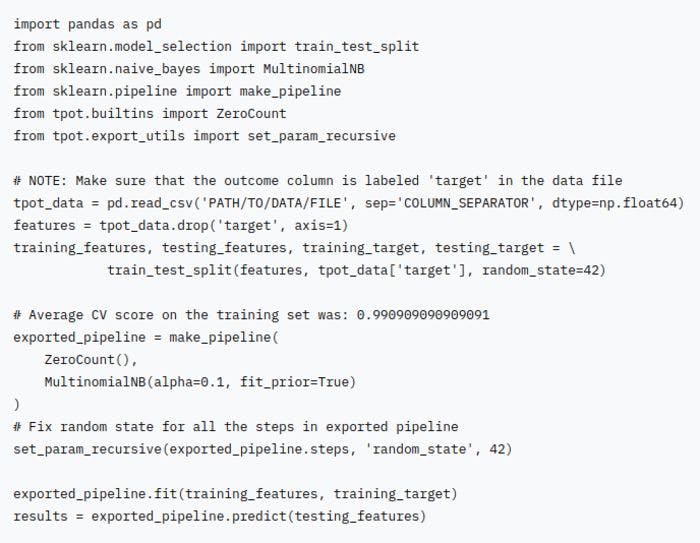
 ...and output the code of the best pipeline (also saved to file):
Output contents of best pipe file
with open (f'{output_folder}/tpot_{dataset}_pipeline_{i}.py', 'r') as best_file:
    code = best_file.read()
st.write(f'```{code}```')
Here's the complete code for Streamlit app (note that nothing beyond this single, short Python script is needed to accomplish everything):
import streamlit as st

import timeit
import pandas as pd
import matplotlib.pyplot as plt

from tpot import TPOTClassifier
from sklearn.model_selection import StratifiedKFold
from sklearn.model_selection import train_test_split
from sklearn.datasets import load_digits, load_iris
from sklearn import metrics
from stqdm import stqdm

@st.cache
def load_data(dataset):
    """Load data"""
    ds = ''
    if dataset == 'digits':
        ds = load_digits()
        df = load_digits(as_frame=True)
    if dataset == 'iris':
        ds = load_iris()
        df = load_iris(as_frame=True)
    X_train, X_test, y_train, y_test = train_test_split(ds.data, ds.target, train_size=train_size, test_size=test_size, random_state=random_state)
    return X_train, X_test, y_train, y_test, df['frame']

if __name__ == "__main__":

    # Set title and description
    st.title("AutoML Pipeline Optimization Sandbox")
    st.write("Experiment with using open source automated machine learning tool TPOT for building fully-automated prediction pipelines")

    # Create sidebar
    sidebar = st.sidebar
    dataset = sidebar.selectbox('Dataset', ['iris','digits'])
    train_display = sidebar.checkbox('Display training data', value=True)
    search_iters = sidebar.slider('Number of search iterations', min_value=1, max_value=5)
    generations = sidebar.slider('Number of generations', min_value=1, max_value=10)
    population_size = sidebar.select_slider('Population size', options=[10,20,30,40,50,60,70,80,90,100])

    random_state = 42
    train_size = 0.75
    test_size = 1.0 - train_size
    checkpoint_folder = './tpot_checkpoints'
    output_folder = './tpot_output'
    verbosity = 0
    n_jobs = -1
    times = []
    best_pipes = []
    scores = []

    # Load (and display?) data
    X_train, X_test, y_train, y_test, df = load_data(dataset)
    if train_display:
        st.write(df)

    # Define scoring metric and model evaluation method
    scoring = 'accuracy'
    cv = ('stratified k-fold cross-validation',
            StratifiedKFold(n_splits=10,
                            shuffle=True,
                            random_state=random_state))

    # Define search
    tpot = TPOTClassifier(cv=cv[1],
                  scoring=scoring,
                  verbosity=verbosity,
                  random_state=random_state,
                  n_jobs=n_jobs,
                     generations=generations,
                  population_size=population_size,
                  periodic_checkpoint_folder=checkpoint_folder)

    # Pipeline optimization iterations
    with st.spinner(text='Pipeline optimization in progress'):
        for i in stqdm(range(search_iters)):
            start_time = timeit.default_timer()
            tpot.fit(X_train, y_train)
            elapsed = timeit.default_timer() - start_time
            score = tpot.score(X_test, y_test)
            best_pipes.append(tpot.fitted_pipeline_)
            st.write(f'\n__Pipeline optimization iteration: {i}__\n')
            st.write(f'* Elapsed time: {elapsed} seconds')
            st.write(f'* Pipeline score on test data: {score}')
            tpot.export(f'{output_folder}/tpot_{dataset}_pipeline_{i}.py')

    # check if pipelines are the same
    result = True
    first_pipe = str(best_pipes[0])
    for pipe in best_pipes:
        if first_pipe != str(pipe):
            result = False
    if (result):
        st.write("\n__All best pipelines were the same:__\n")
        st.write(best_pipes[0])
    else:
        st.write('\nBest pipelines:\n')
        st.write(*best_pipes, sep='\n\n')

    st.write('__Saved to file:__\n')
    st.write(f'```{output_folder}/tpot_{dataset}_pipeline_{i}.py```')
    st.success("Pipeline optimization complete!")

    # Output contents of best pipe file
    with open (f'{output_folder}/tpot_{dataset}_pipeline_{i}.py', 'r') as best_file:
        code = best_file.read()
    st.write(f'```{code}```')
And that's how to quickly build an AutoML pipeline optimization sandbox powered by Streamlit and TPOT, using only Python code. Note the lack of web programming skills we needed to succeed in doing so.
Very nice. Great success!